Health data is most useful when it is connected. Sleep tracked in one app, steps logged in another and blood pressure recorded in a notebook rarely speak to each other, and the resulting picture is fragmented. The most insightful wearable experiences bring these signals together on a single timeline, so the relationships between them become obvious. A number in isolation is rarely informative; a number in context is.
Consider a typical week. A night of poor sleep, followed by a stressful workday and a short, restless walk, produces a predictable cascade: lower overnight heart rate variability, a lower readiness score the next morning, and a higher likelihood that an intense workout will feel heavy. Conversely, a week of consistent moderate movement, regular bedtimes and relaxed weekends often yields steady readiness scores and a favourable drift in resting blood pressure. These connections are invisible when data lives in separate silos, which is why the timeline matters as much as any individual graph.
Sleep itself deserves particular attention. Modern wearables distinguish deep sleep, light sleep and rapid eye movement, and the balance between these stages tells a richer story than total hours alone. A night that looks adequate on paper — eight hours in bed — may still feel unrefreshing if deep sleep was short and awakenings were frequent. Pairing that breakdown with the following day’s readiness score helps the wearer understand, over time, what good sleep actually looks like for them personally, rather than relying on generic advice.
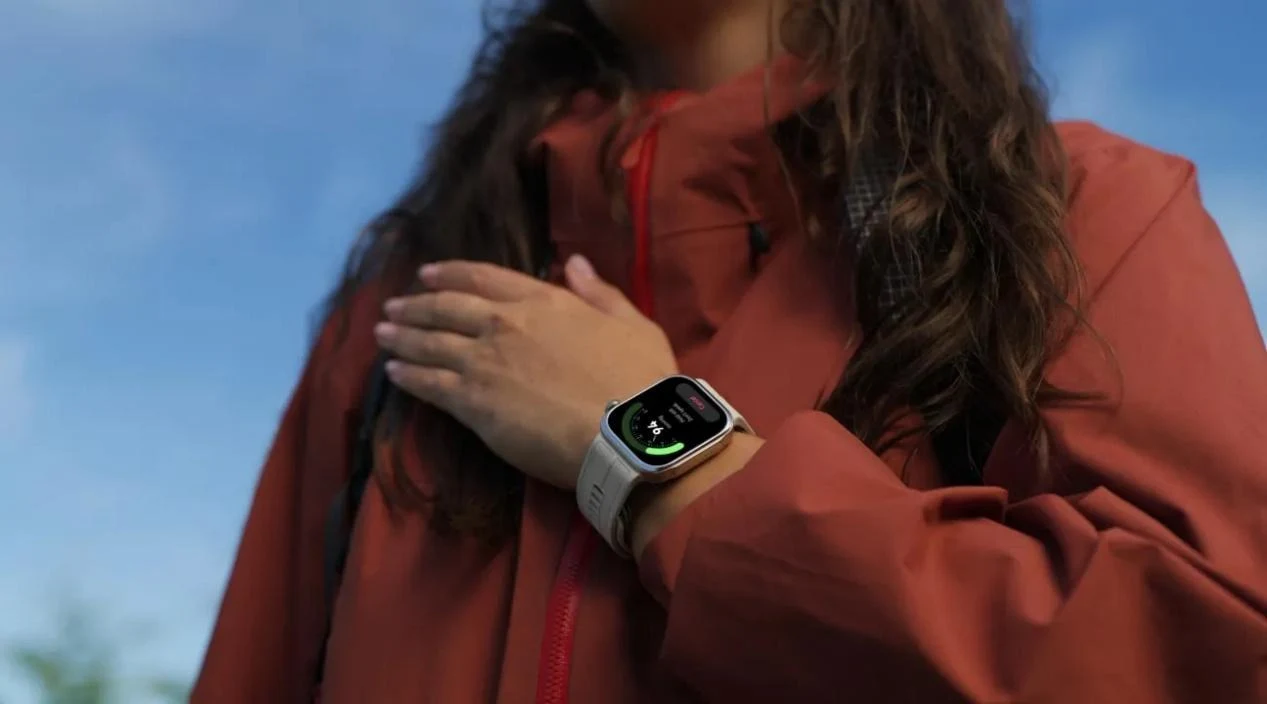
A cohesive activity tracker watch brings sleep stages, daily movement and a readiness score onto one timeline, so patterns become obvious. Deep sleep, light sleep and rapid eye movement are charted through the night; active minutes and pulse response are logged through the day; on-demand blood pressure readings can be dropped onto the same timeline at moments of interest. The wearer begins to see, for example, that evenings spent near screens correlate with lighter sleep, and that a long morning walk predicts a better evening. This integrated view is the reason ambulatory, multi-signal tracking is increasingly valued by clinicians. For a clear explanation of how such contextual, time-stamped readings should be interpreted, a specialist discussion of exercise and blood pressure is a useful reference.
Connected data also helps avoid overreaction to any single metric. A high blood pressure reading after a rushed morning is more understandable when the sleep log shows a broken night and the stress score from the previous day was elevated. The context softens the alarm and points toward a more useful follow-up, such as a calmer measurement later in the day. Over time, the wearer becomes skilled at distinguishing meaningful trends from the noise of ordinary life.
The ultimate value of wearable health technology is not the numbers themselves. It is the gentle, ongoing self-knowledge that comes from seeing how one’s own choices and physiology interact, day after ordinary day. When sleep, movement and recovery share a single timeline, that knowledge becomes both visible and actionable — the foundation of genuinely long-term cardiovascular wellbeing.
Alcohol is one of the most reliable disruptors of sleep quality, and the integrated timeline makes that obvious. A glass of wine with dinner often shows up as lighter deep sleep, more overnight awakenings and a lower readiness score the next morning, even when the wearer feels as though they slept fine. Over weeks, the relationship between evening drinking and the following morning’s data becomes clear, and small adjustments — an earlier last drink, a glass of water alongside it — often produce a noticeable improvement in recovery scores.
Travel and jet lag also leave a clear footprint. Long flights, time-zone shifts and disrupted routines produce a few days of elevated resting pulse, fragmented sleep and lower readiness before the system resettles. Rather than pushing through planned hard sessions during these periods, the integrated timeline makes it obvious that a few easy days are the wiser choice. The wearer learns to read the post-travel dip not as weakness, but as the expected cost of being away from routine.
Work stress is the invisible factor that ties many of these signals together. A high-pressure project week often shows up as shorter sleep, higher resting pulse, lower HRV and an elevated evening blood pressure average. Seeing that cluster on a single timeline makes it harder to dismiss the stress as purely mental; the body is clearly carrying it too. That awareness is often the first step toward making changes — a short midday walk, an earlier finish, a deliberate wind-down — that protect cardiovascular health through demanding periods.
When sleep, steps and readiness share a single timeline, the wearer stops treating them as separate items on a health checklist and starts seeing them as parts of one connected system. That shift in perspective is, more than any individual metric, what makes wearable data genuinely useful for long-term cardiovascular care.